Super El Niño Live Map Shows Its Tongue Swelling Toward Winter Peak - Newsweek
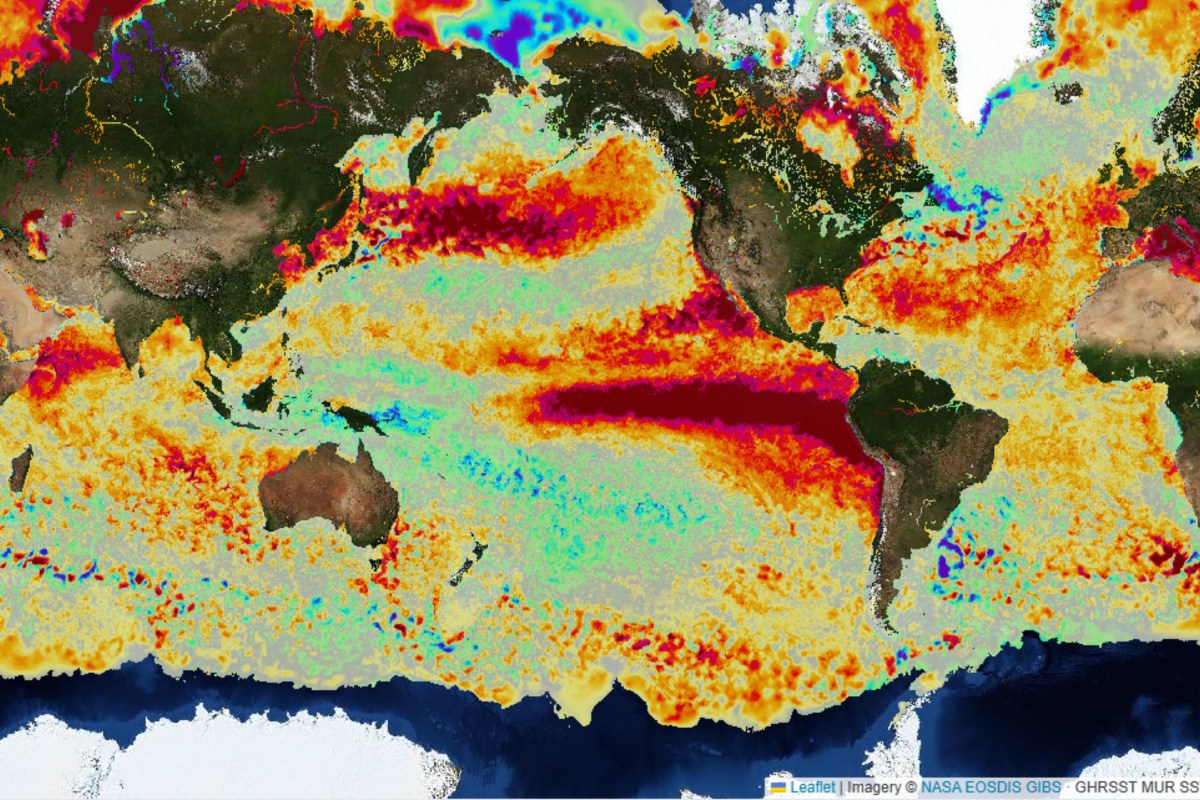
A tongue of unusually warm water has grown broader and more continuous across the Pacific since April, maps tracking a strengthening El Niño illustrate.
El Niño is a naturally recurring Pacific climate pattern associated with warmer Pacific waters and is known to influence temperature and rainfall patterns worldwide. The event is currently ongoing and has already broken records.
Earlier this month, federal forecasters said El Niño was highly likely to become "very strong" during the Northern Hemisphere fall and winter. There was also a 75 percent chance during October-December for a historic event, stronger than all previous El Niños dating back to 1950, they said.
During 1997–98, unusually warm tropical Pacific waters contributed to major disruptions in global weather patterns, including severe flooding in parts of the Americas and drought and wildfires in Indonesia and Australia. The 2015–16 event was similarly intense, with widespread heat, heavy rainfall and drought, and it helped make 2016 the warmest year on record at the time.
According to ElNinoLive, one of the defining signs of El Niño is a tongue-shaped band of unusually warm water extending thousands of miles along the equator from the coast of South America.
It explains that, in a typical year, trade winds push surface water westward, while colder water rises from deeper in the ocean near Peru and Ecuador, keeping this part of the Pacific relatively cool. When those winds weaken, warm water that has accumulated in the Western Pacific moves back east and the normal upwelling is suppressed, producing the warm tongue visible on the map.
The site added that a stronger and more continuous tongue is associated with a stronger El Niño event.
The live map depicts the warm tongue becoming progressively more pronounced across the equatorial Pacific. The data is sourced from NASA satellites, according to the site.
On April 15, the warmer-than-average water appears relatively diffuse and broken up.
By May 27, a clearer band extends westward from the South American coast.
The feature becomes broader and more continuous by July 8, before expanding further by September 22, when the strongest anomalies form a thick, largely unbroken tongue stretching across much of the eastern and central equatorial Pacific.
The colors represent how much warmer or cooler the ocean surface is than its long-term average for the time of year, with gray indicating near-normal conditions, yellow through red showing unusual warmth, and green through purple identifying cooler-than-average water. The darkest red areas are 2 to 3 degrees Celsius above normal, according to ElNinoLive.
While the maps above illustrate sea-surface temperature anomalies, NOAA said those short-term changes are not the measure it uses to assess El Niño’s broader strength and impacts.
"We're not closely monitoring day-to-day changes in sea surface temperature in the equatorial Pacific because they don't affect the overall strength of El Niño or its downstream impacts," National Weather Service spokesperson and meteorologist Erica Cei told Newsweek.
In California, Governor Gavin Newsom declared a statewide state of emergency on Monday "to mobilize state resources for a potentially historic El Niño winter in California."
Newsom’s proclamation instructed the California Department of Water Resources to ready flood-fighting supplies such as sandbags, plastic sheeting, pumps and rock materials. It also orders officials to engage with dam owners and local agencies responsible for levees and flood-control structures.
It also directed transport officials to identify vulnerable highways, bridges, culverts and other transport infrastructure, while developing plans to position road-closure, traffic-control and emergency communications equipment around at-risk locations. Snowplows, snow blowers, graders, loaders and chain-control equipment were included in the preparations.